- sales@hot-mining.com +86 28 8331 1885 +86 15196677188
-

-

-


01 Introduction
Grade dilution is a critical issue in converting geological resources into minable reserves because it directly affects the grade, tonnage, and cost of ore entering the plant, as well as the economic value of the project. Explicitly simulating these dilution effects in block models, rather than applying general dilution factors, can provide a more reliable foundation for mine design and long-term scheduling.
02 Core Concepts and Dilution Types
Dilution refers to the proportion of non-ore material (waste) mixed with ore during mining, typically expressed as a percentage of the total material mined (ore + waste). By mass, it is defined as the ratio of waste weight to the total weight of ore plus waste. When calculated by volume, the densities of ore and waste can be used for conversion.
In block model-based planning, it is necessary to distinguish between the following types of dilution:
Internal Dilution
Waste or low-grade material inevitably mined along with ore within the orebody, such as gangue inclusions, Low-grade ore lenses, or internal weakening zones. This also reflects the effect of small-scale geological variations averaged at the block scale. Internal dilution is essentially a geological and support issue.
Geologic Contact Dilution
Dilution arising from the geometric shape of blocks, minimum mining width, or fixed block sizes, leading to ore and surrounding rock material being mixed. In fixed-size block models, boundary blocks often partially lie outside the actual orebody; this type is referred to as contact dilution.
External or Operational Dilution
Additional waste material incorporated outside the designed orebody due to mining operations such as drilling, blasting, loading, over-excavation, blast-induced rock movement, poor boundary control, or equipment limitations. Many analyses, empirical studies, and numerical models simulate external dilution based on operational parameters.
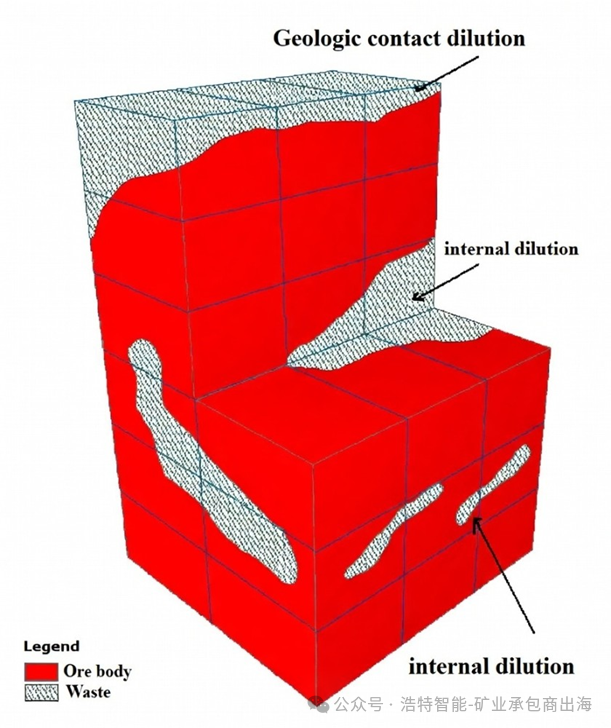
Figure 1: Illustration of dilution types.
This paper focuses on how to quantitatively determine internal and external dilution, and on simulating their effects within a block model, with an emphasis on methods using geological and grade data.
03 Economic Motivation: Why Model Dilution
Dilution lowers ore grade, increases mined tonnage, extends the mine life, and reduces net present value (NPV) and return on investment (ROI). In ore-waste contact zones, dilution can reduce grades below the economic cutoff, making processing impossible. Higher waste proportions also directly increase mining and processing costs and complicate waste disposal and inventory management.
Since cutoff grades, pit limits, and scheduling decisions all depend on block grade and tonnage, a block model that incorporates dilution can provide more realistic long-term production forecasts and better control of mill feed grade variability.
04 Mathematical Description of Dilution and Diluted Grade
Dilution Definition (by Mass)
If (mW) is the waste mass and (mO) is the ore mass, the dilution rate (D) is:
D = mW / (mW + mO)
Considering ore and waste densities (pO and pW), this can be converted to volume, facilitating the block model to explicitly track both volume and density.
Diluted Grade
For a single element, let the ore grade be gO and the waste grade be gW. The final grade gT, accounting for internal dilution, can be calculated using the following formula:
gT = (gO x mO + gW x mW) /(mO+ mW)
This formula can be used to calculate the final grade of each block after internal dilution. For a block consisting entirely of ore, the grade remains unchanged before and after dilution.
In practice, representative average grades and densities of waste rock can be assumed to calculate gT and D for each block. For example, in a case study of an iron ore deposit, the Fe and FeO grades in the waste rock are taken as 5% and 2%, respectively, with densities 2.65 g/cm³(waste) and 4 g/cm³(ore). (Masoumi, Kamali, & Asghari, 2019).
05 Determination of Internal Dilution: Geological and Geostatistical Methods
Internal dilution occurs when a block contains a mixture of ore and waste or exhibits variability in ore grade, potentially due to:
●Thin waste or vein bands within the orebody
●Low-grade ore veins or lenses
●Geological variation within the block scale
●Fixed, relatively large block sizes crossing actual geological boundaries
Fixed-size block models can lead to blocks near orebody edges extending beyond the ore, automatically increasing the dilution rate of these "boundary blocks."
06 Workflow Using Sequential Indicator Simulation (SIS) and Multivariate Simulation
At the Gohar Zamin iron ore deposit, research shows a combined approach for quantifying internal dilution block-by-block and correcting grades:
a. Data Preparation and Coding
Drill core samples are composited at reasonable intervals (e.g., 2 m) and coded as ore or waste based on lithological descriptions (Masoumi, Kamali, & Asghari, 2019). Assay data for key elements (Fe, FeO, P, S) are composited over appropriate lengths (e.g., 6 m) for use in grade modeling.
b. Geological Domain and Block Model Definition
An initial geological model is constructed based on the first and last occurrence positions of ore in each drill hole, thereby defining the space for internal dilution simulation (Masoumi, Kamali, & Asghari, 2019). A regular block model is then constructed within this domain, with fixed block sizes (e.g., 10 x 10 x 15 m).
c. Lithology Simulation (SIS):
Lithology (ore and waste) is treated as a categorical variable and simulated using Sequential Indicator Simulation (SIS), with indicator variograms used to capture anisotropy and spatial structure (Masoumi, Kamali, & Asghari, 2019). A large number of realizations (e.g., 100) are generated, from which the E-type (mean) probability of ore occurrence in each block is calculated (Masoumi, Kamali, & Asghari, 2019). The resulting E-type probability maps reveal spatial distribution patterns, such as lower ore probabilities at the orebody edges.
d. Block-by-Block Internal Dilution Calculation
For each block, the proportions of ore and waste are calculated based on ore occurrence probability, density, and total block volume, and the internal dilution rate (DDD) is assessed using a volumetric density formula. Blocks with high dilution generally correspond to thick waste layers or blocks partially located outside the orebody. These high-dilution blocks can be mapped to highlight problematic areas (e.g., blocks with dilution rates exceeding 50% are marked in blue).
e. Multivariate Grade Co-Simulation (MAF):
Continuous grade variables (Fe, FeO, P, S) are co-simulated using the Minimum/Maximum Autocorrelation Factor (MAF) method. The variables are first transformed into Gaussian scores and the covariance matrix is computed. Principal components are obtained via eigen decomposition, and then rotated to spatially decorrelated MAF factors (Masoumi, Kamali, & Asghari, 2019). Each MAF factor has approximately zero mean and unit variance, with spatial decorrelation verified by cross-variograms (Masoumi, Kamali, & Asghari, 2019). The factors are independently simulated (e.g., using Sequential Gaussian Simulation), and then back-transformed to recover the correlated grade variables, effectively reproducing the original correlations.
f. Calculation of Final (Diluted) Block Grades
For each block, the internal dilution proportion is combined with the simulated ore grade (assuming the waste grade is known) to calculate the final Fe and FeO grades using the aforementioned mixing formula (Masoumi, Kamali, & Asghari, 2019). In regions with very low ore occurrence probability (e.g., 10%), the final Fe and FeO grades may drop to levels at which the block should be considered waste rather than ore. Conversely, in the presence of thin internal waste layers, moderate internal dilution may reduce the Fe grade from 62.2% to 58.95%."
07 Case Study Results and Interpretation
In the northern part of the Gohar Zamin iron ore deposit, the integrated SIS–MAF method calculated an average internal dilution of approximately 10% across all simulated blocks (Masoumi, Kamali, & Asghari, 2019). Although slightly higher than the experimentally assumed whole-deposit internal dilution (7.5–8%), this approach provides block-by-block estimates of specific dilution rates and adjusted grades.
On average, considering internal dilution, the Fe and FeO grades decrease by approximately 10% compared with simulation results that ignore dilution (Masoumi, Kamali, & Asghari, 2019). Many blocks with dilution rates exceeding 50% are located in areas with thick waste layers, which can help guide selective mining or redesign of mining plans.
Importantly, the internal dilution estimates obtained using this method are in strong agreement with lithological measurements from blast holes. For example, one blast pattern showed an ore length of 612 m and a waste length of 137 m within the ore zone, corresponding to a dilution rate of approximately 11%, which is very close to the simulated value of around 10% (Masoumi, Kamali, & Asghari, 2019). This validation supports the use of the method in long-term mine planning.
Continue Reading
Due to the length of this article, the remaining sections are presented in the next part: Click here.